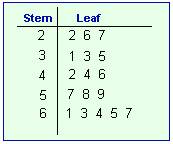
A Stem & Leaf Plot is a map used in statistics that presents quantitative data in a graphical format. This graph comes from Arthur Bowley, and is used a lot in exploratory data analysis. The most basic stemplot is created from two columns separated by a single vertical line. The "stems" are located on the left and the "leaves" on the right. These graphs quickly show the viewer the ranges of distribution of numerical data. The leaf represents the "ones" place, while the stem represents the rest of the number.
The Stem & Leaf Plot used in this example displays the number of students enrolled in a certain class over the past 12 years. The numbers are 81, 84, 85, 86, 93, 94, 97, 100, 102, 103, 110 & 111. It is clear to see from a quick glance at the map that the most common class size was somewhere in the 80's, and the classes containing 110 or more students was the least frequent.
No comments:
Post a Comment